El paso community college ANALYSIS
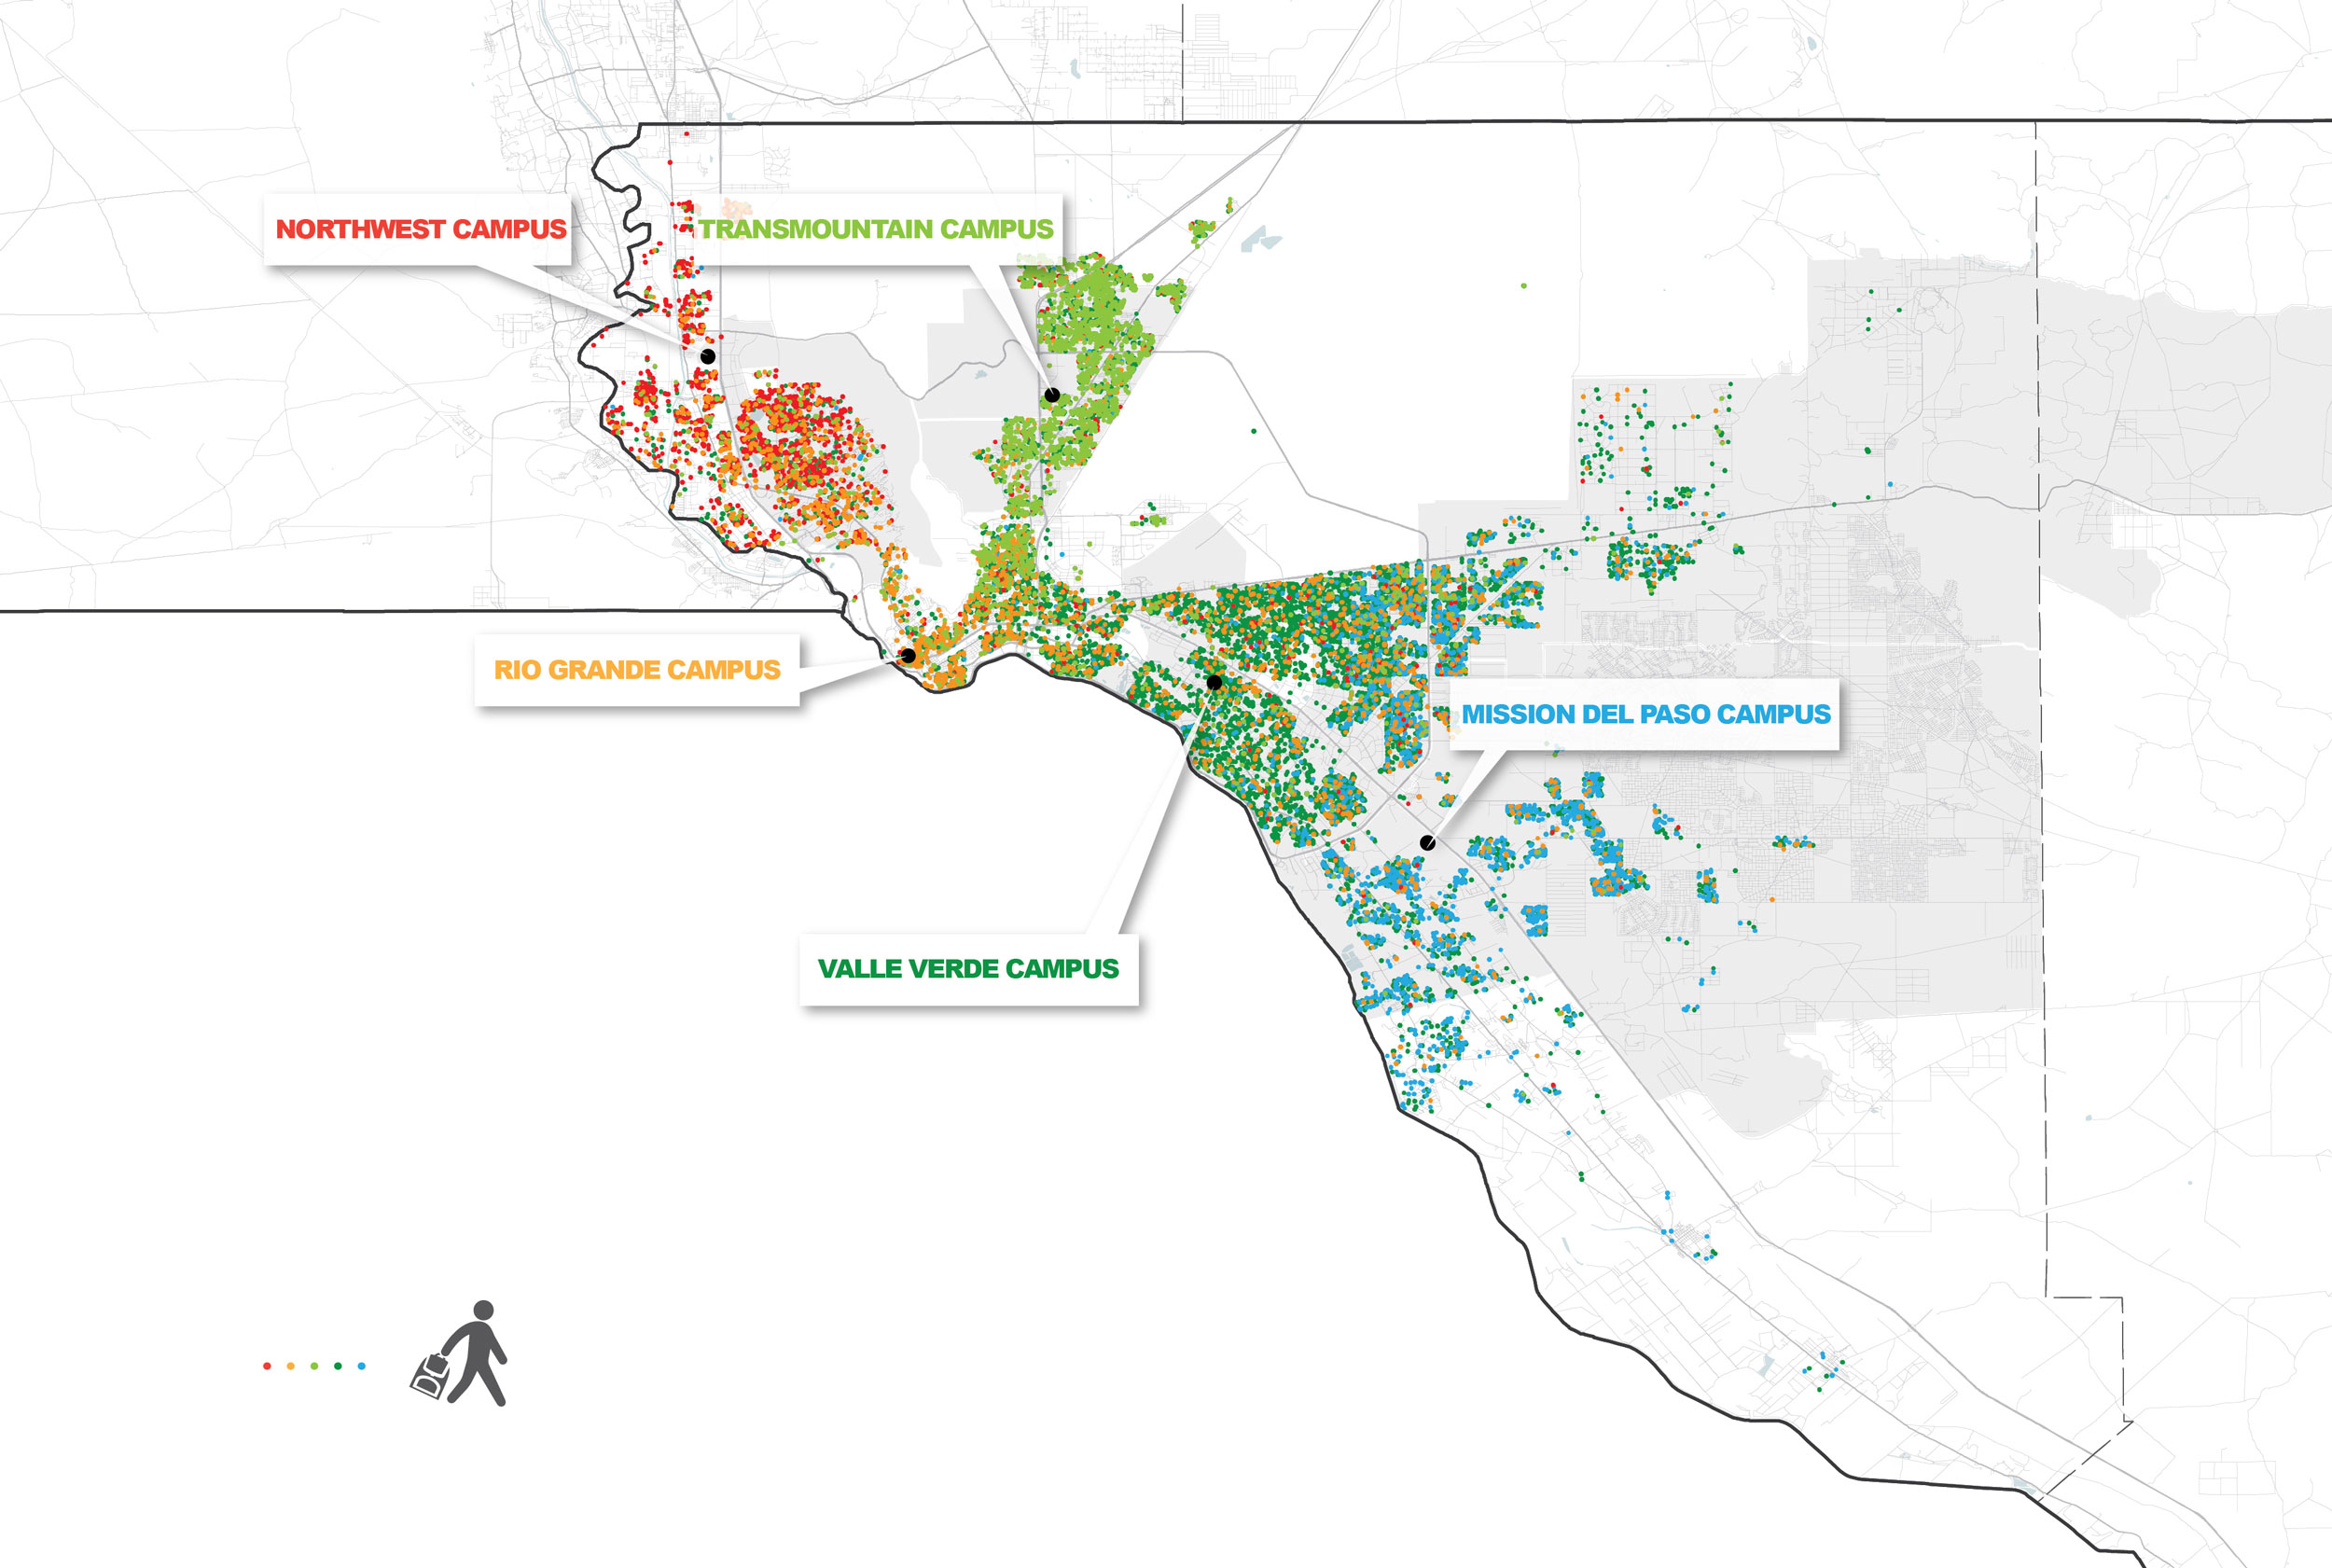
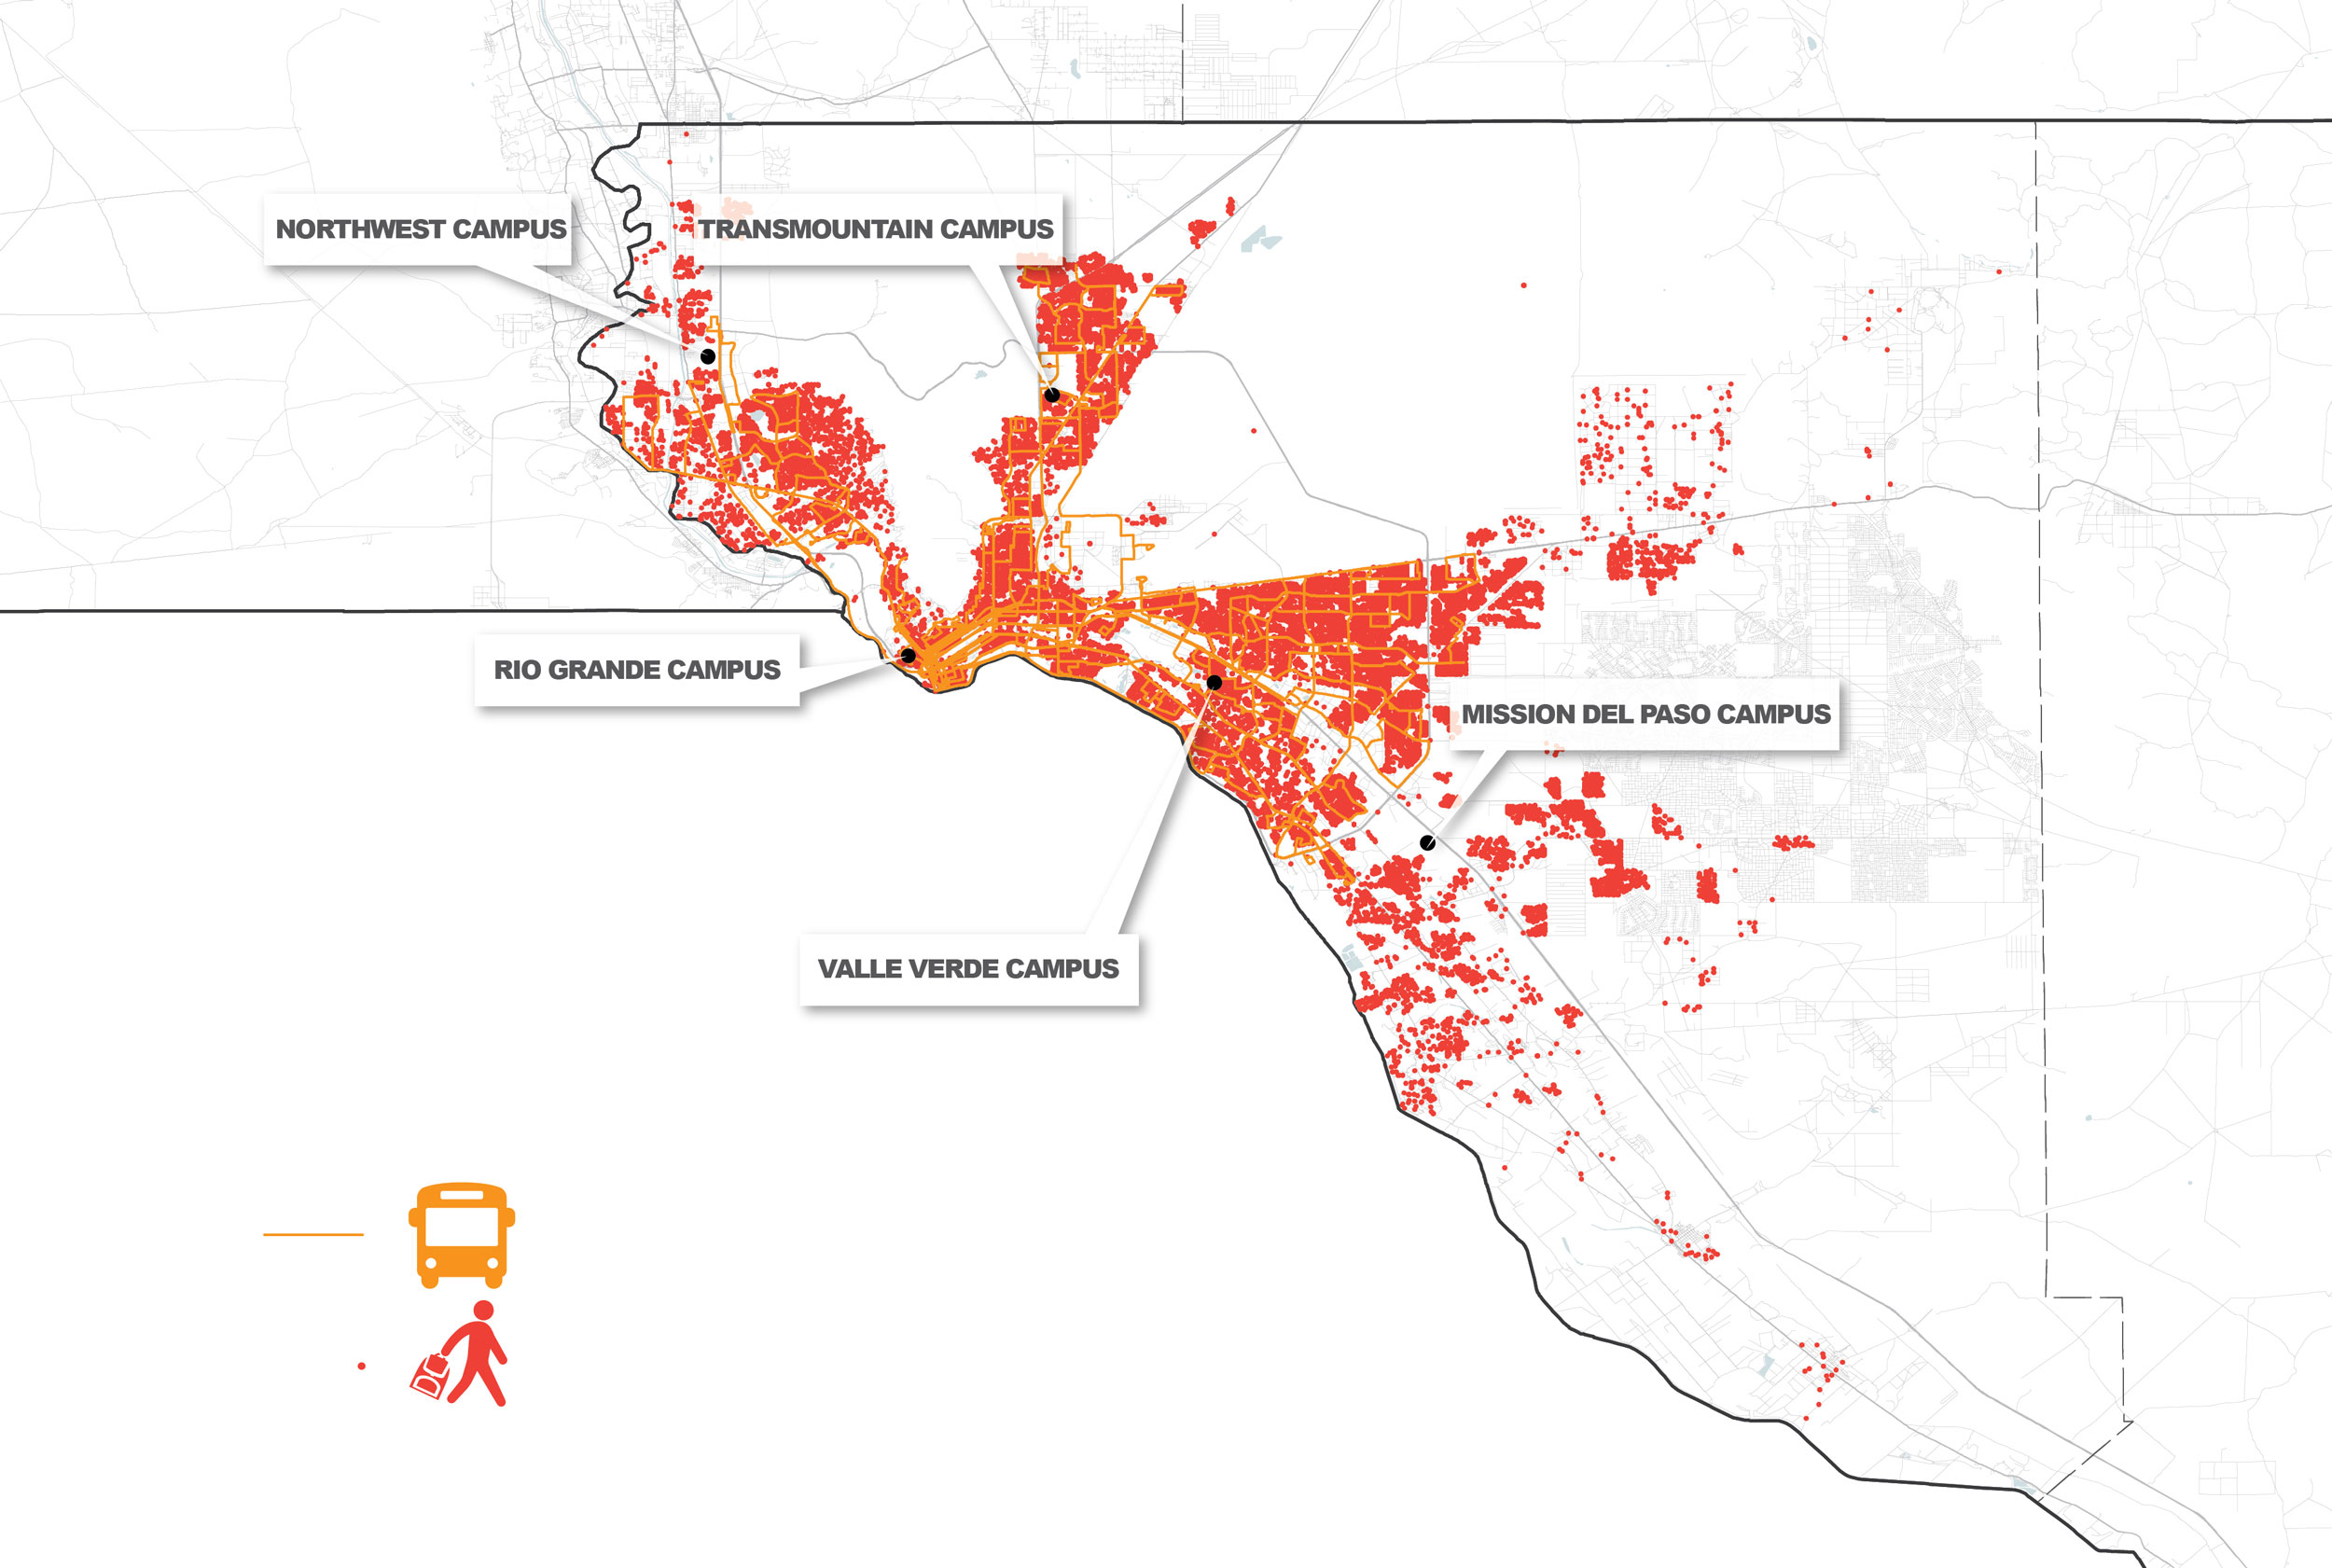
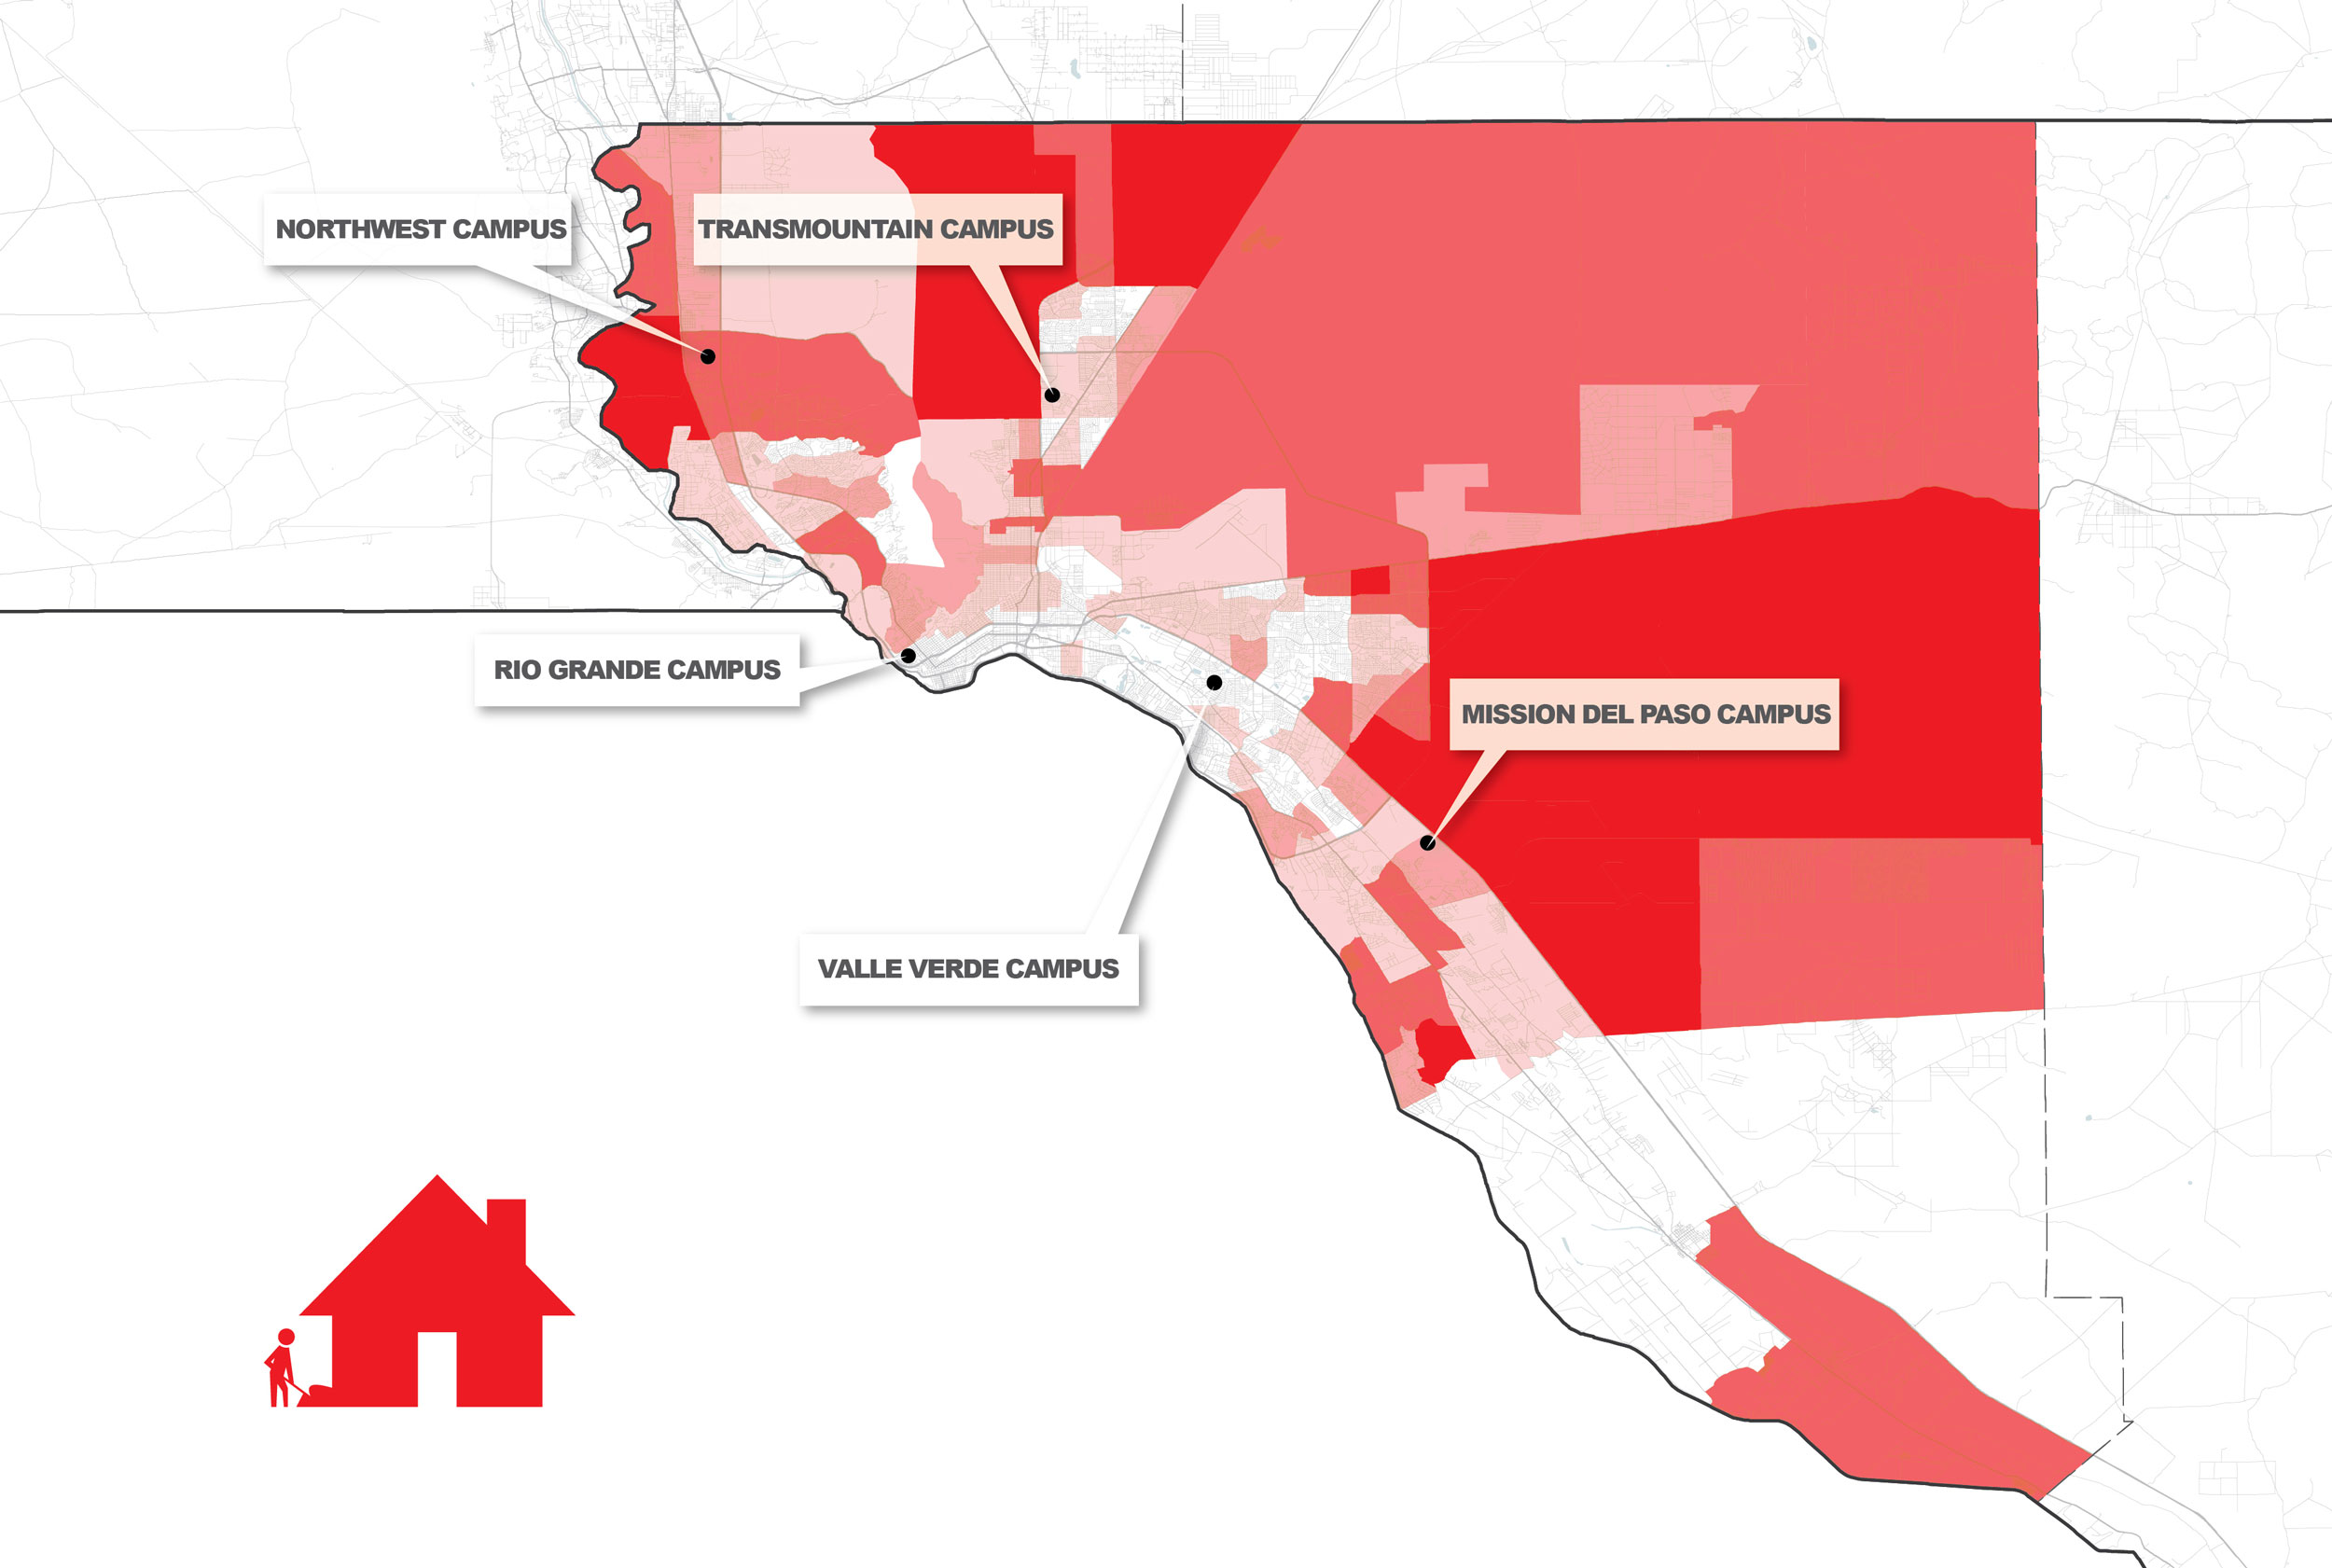
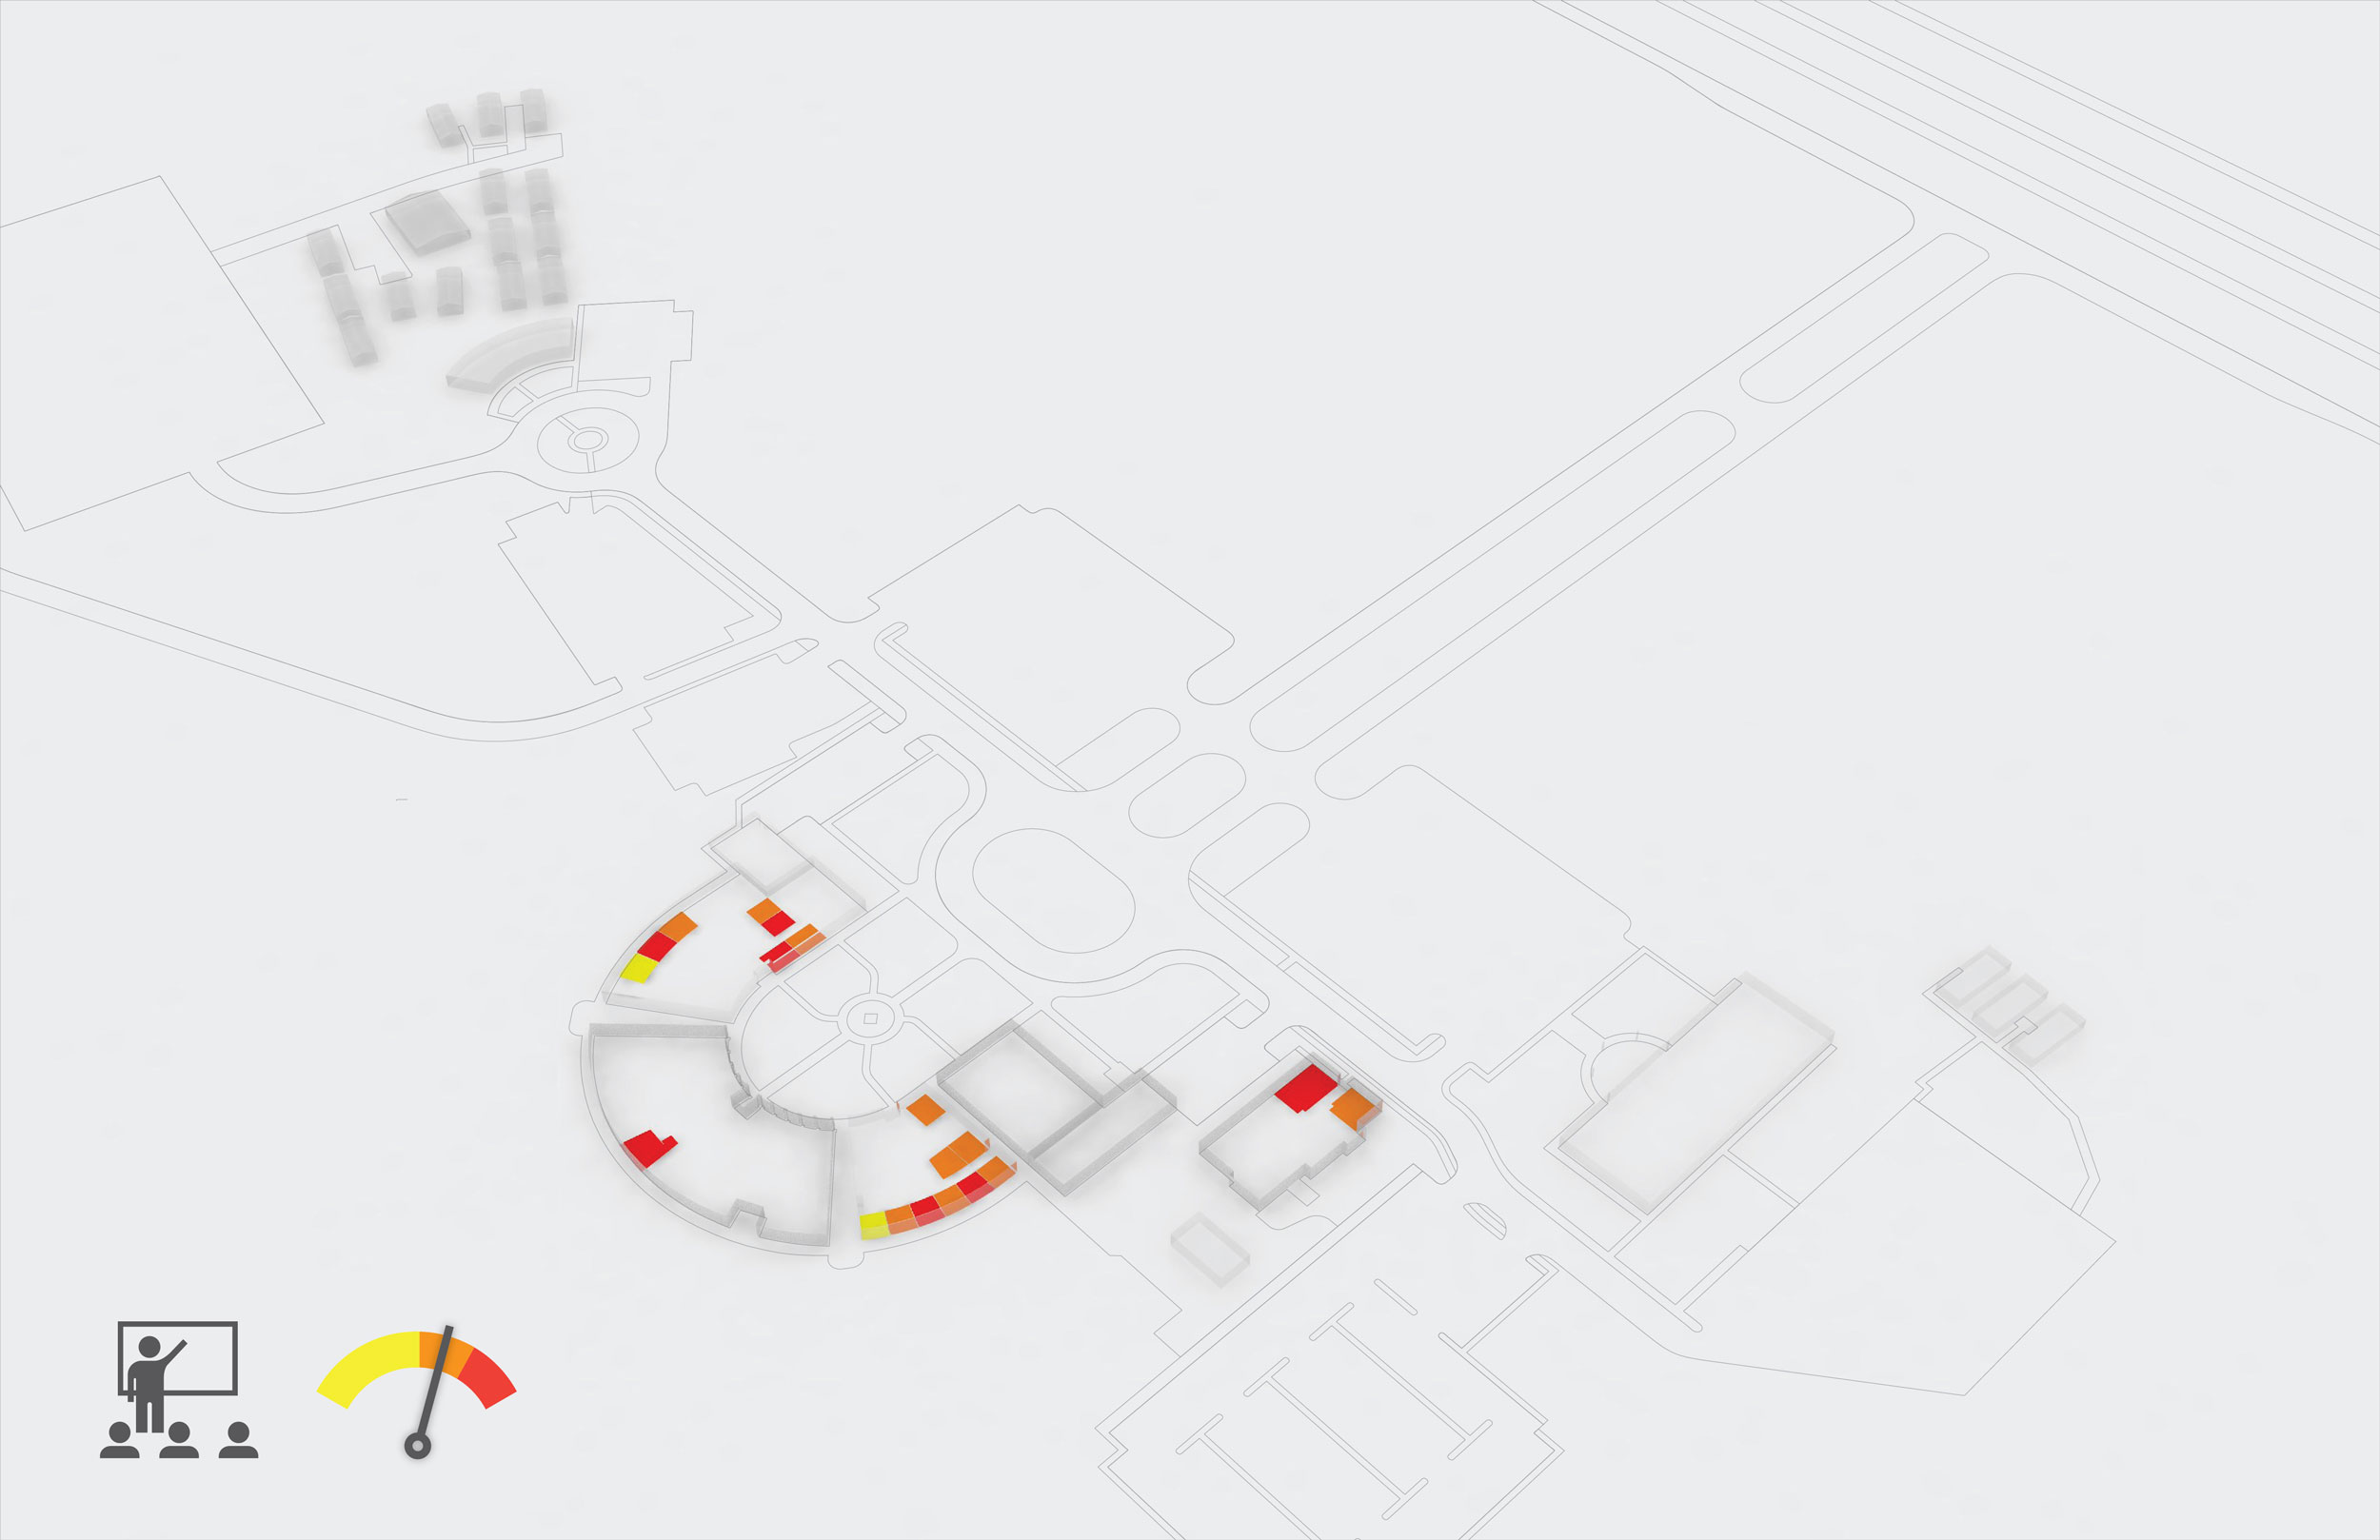
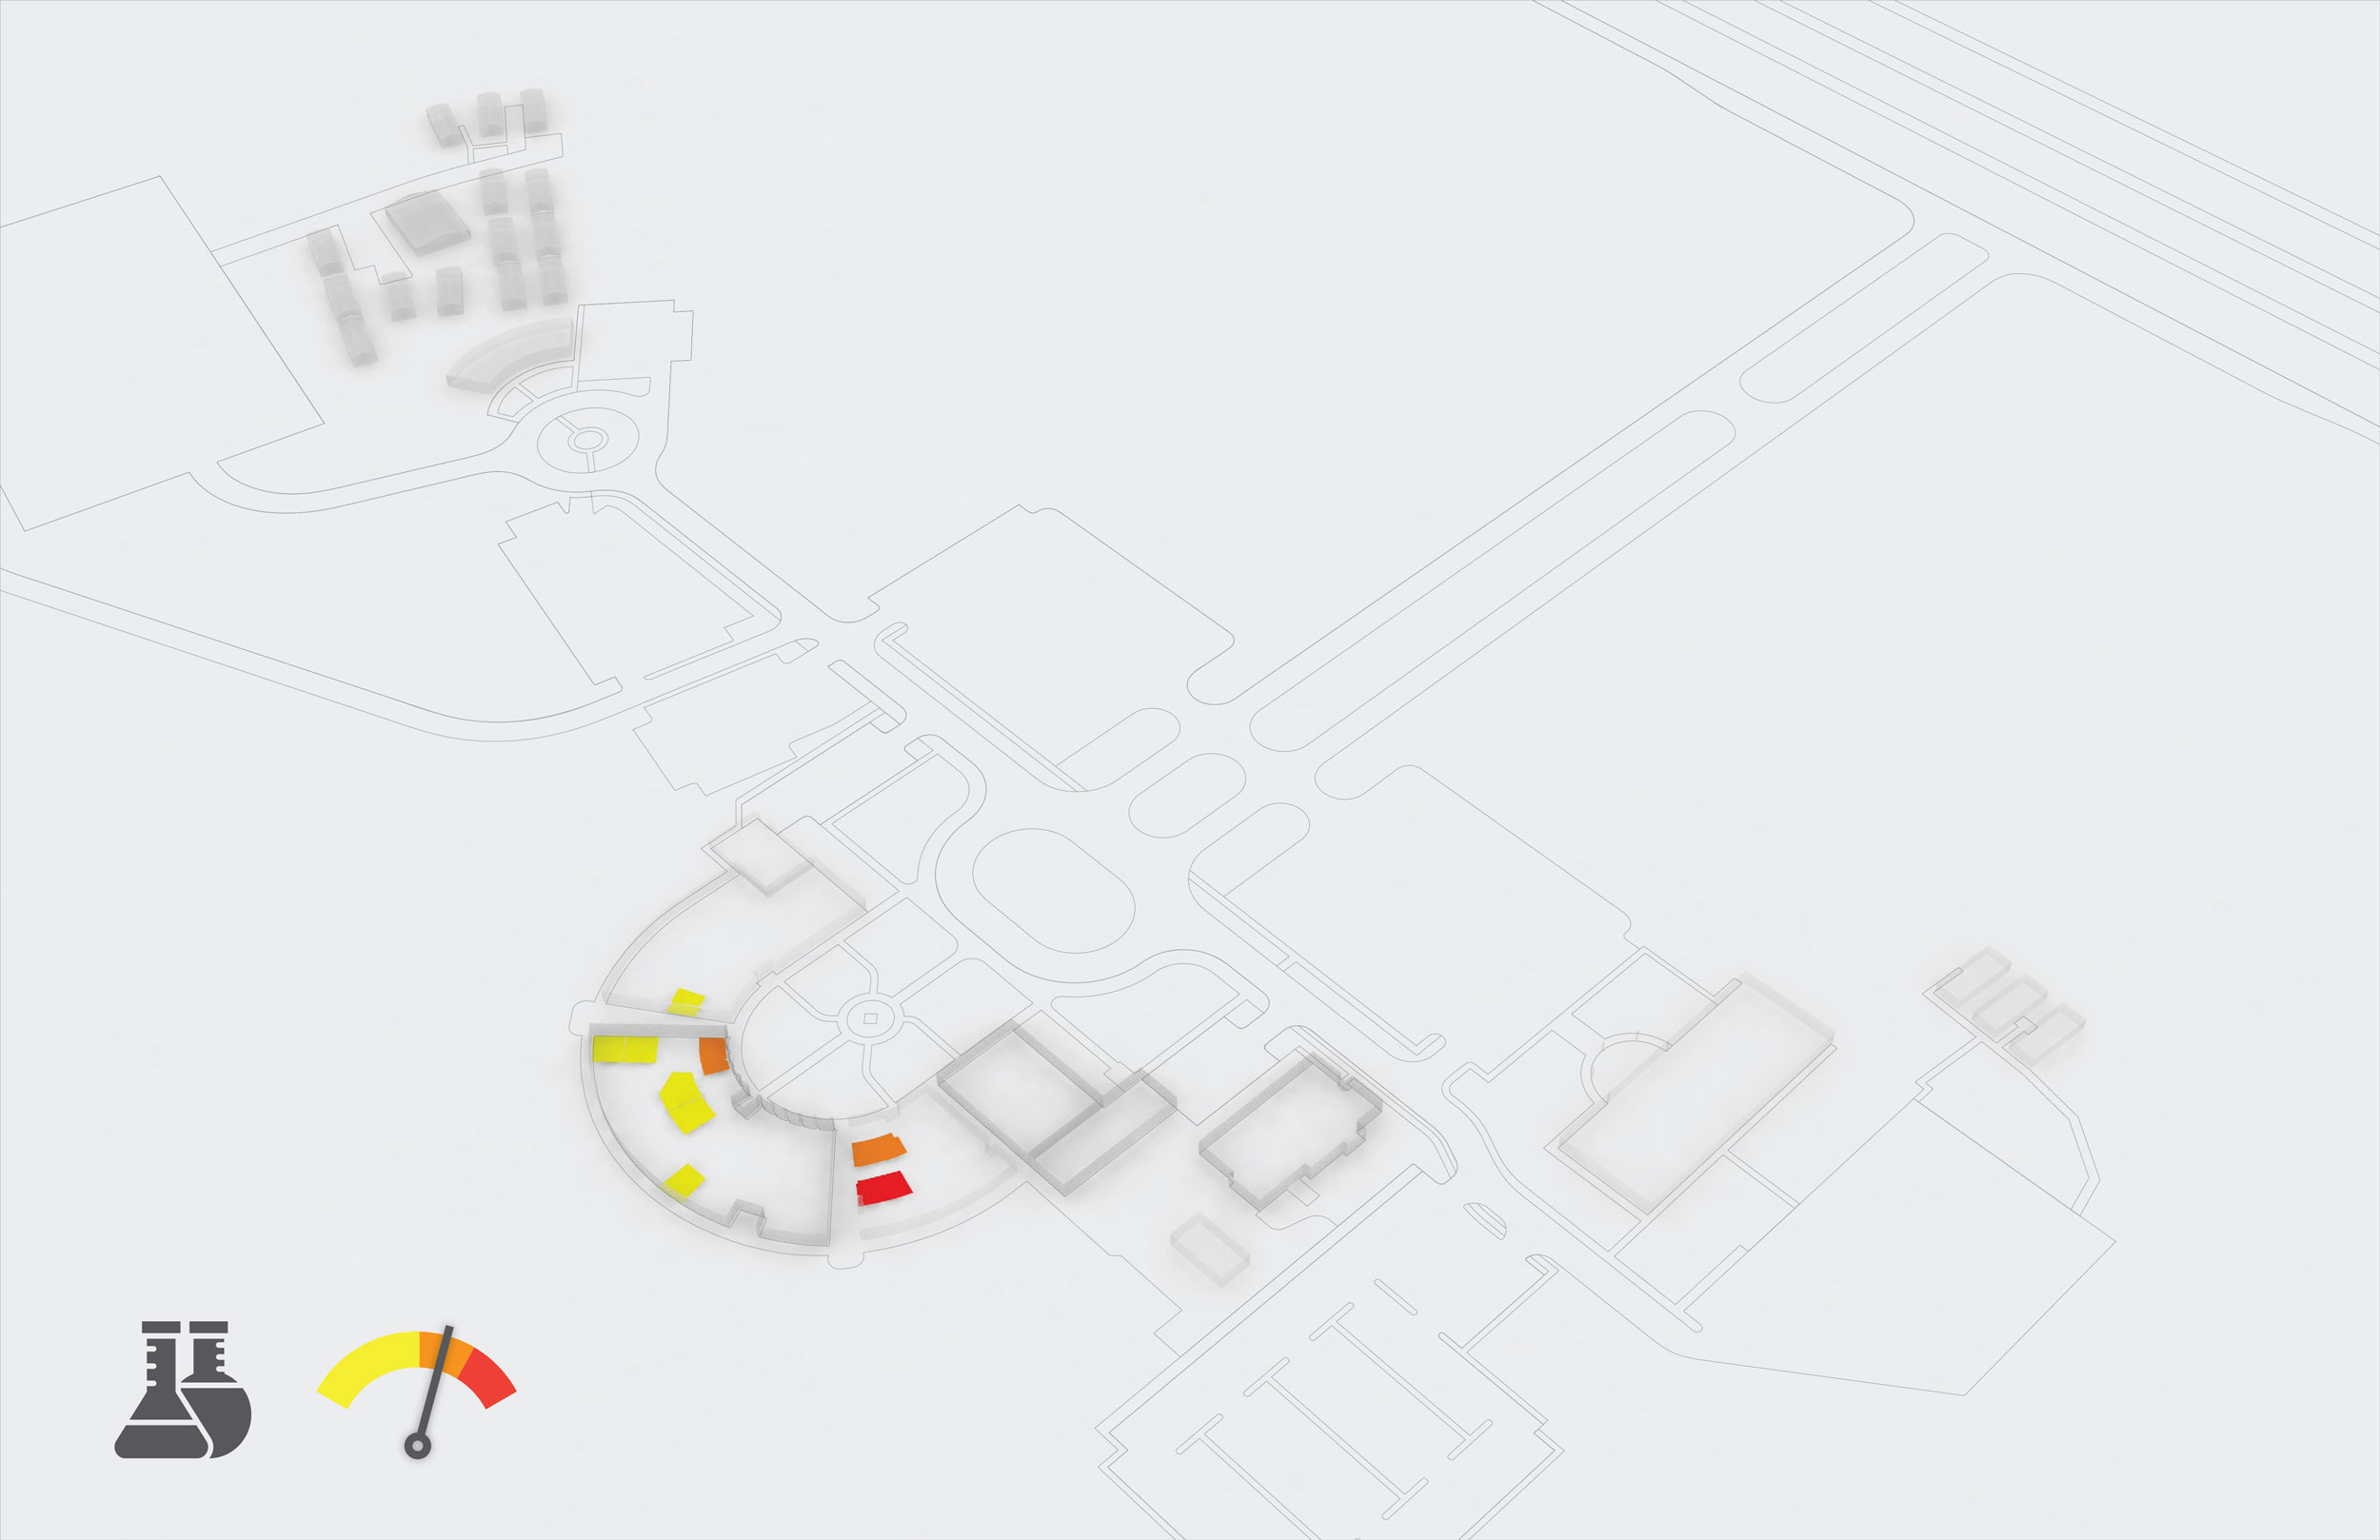
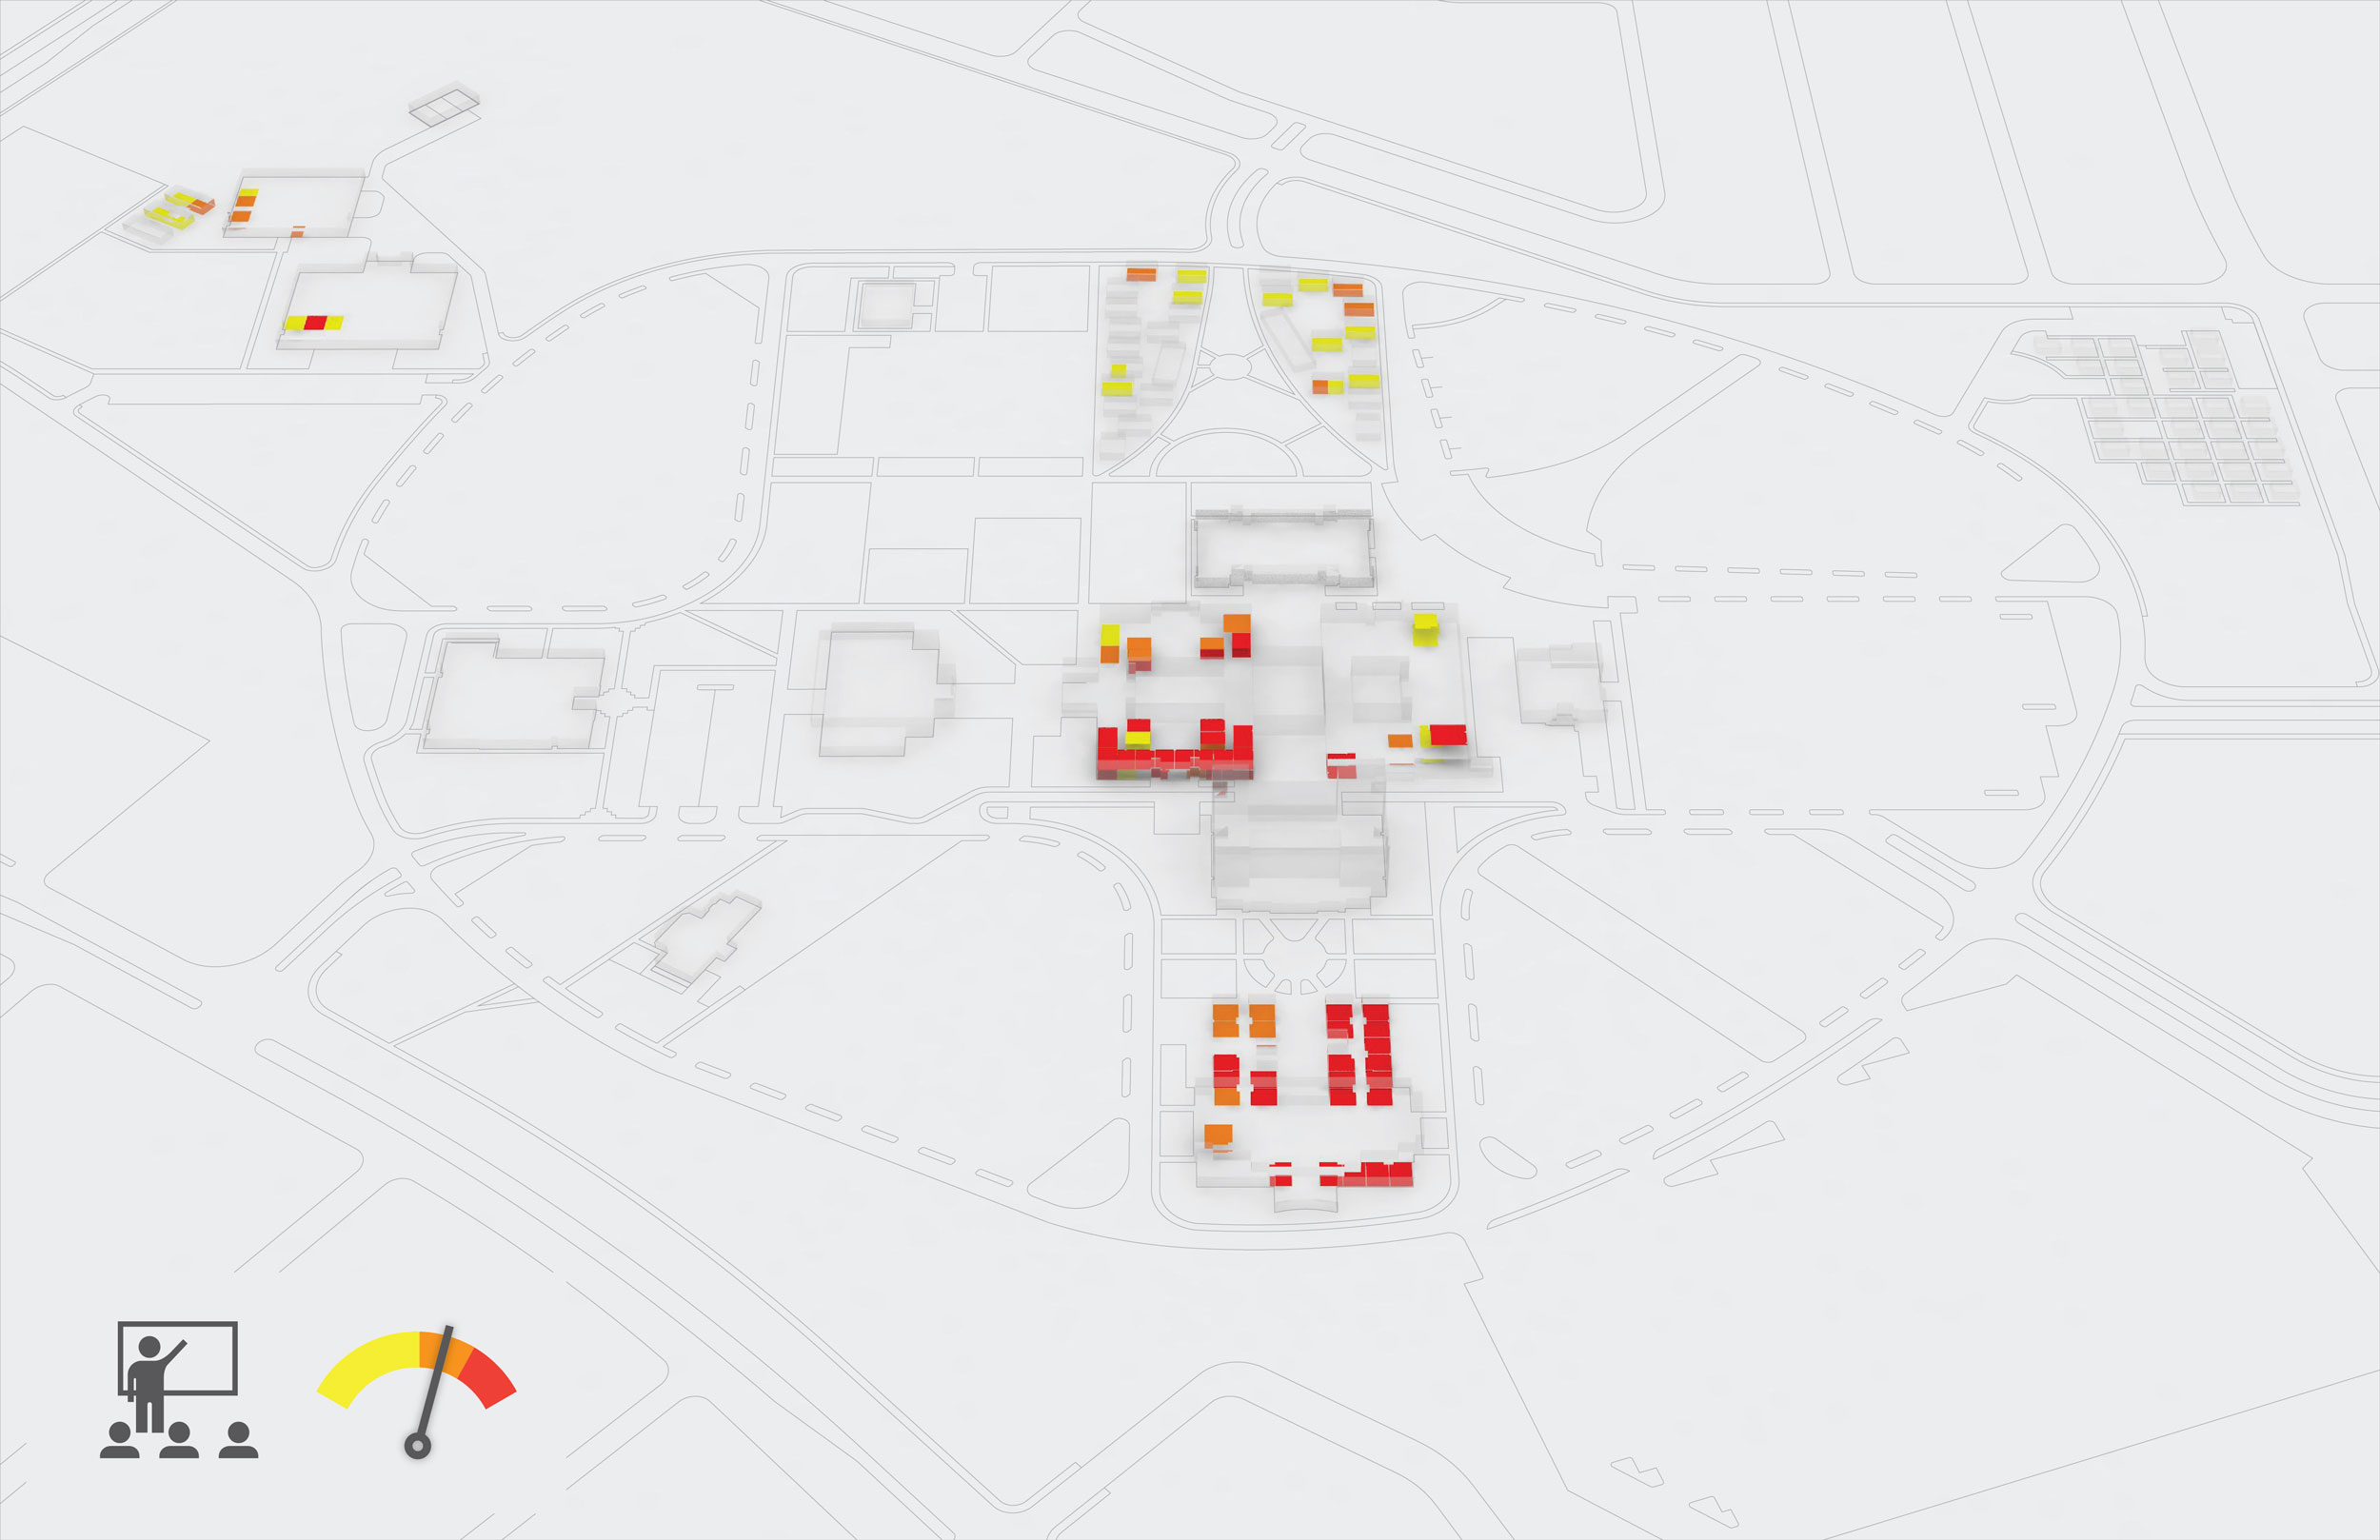
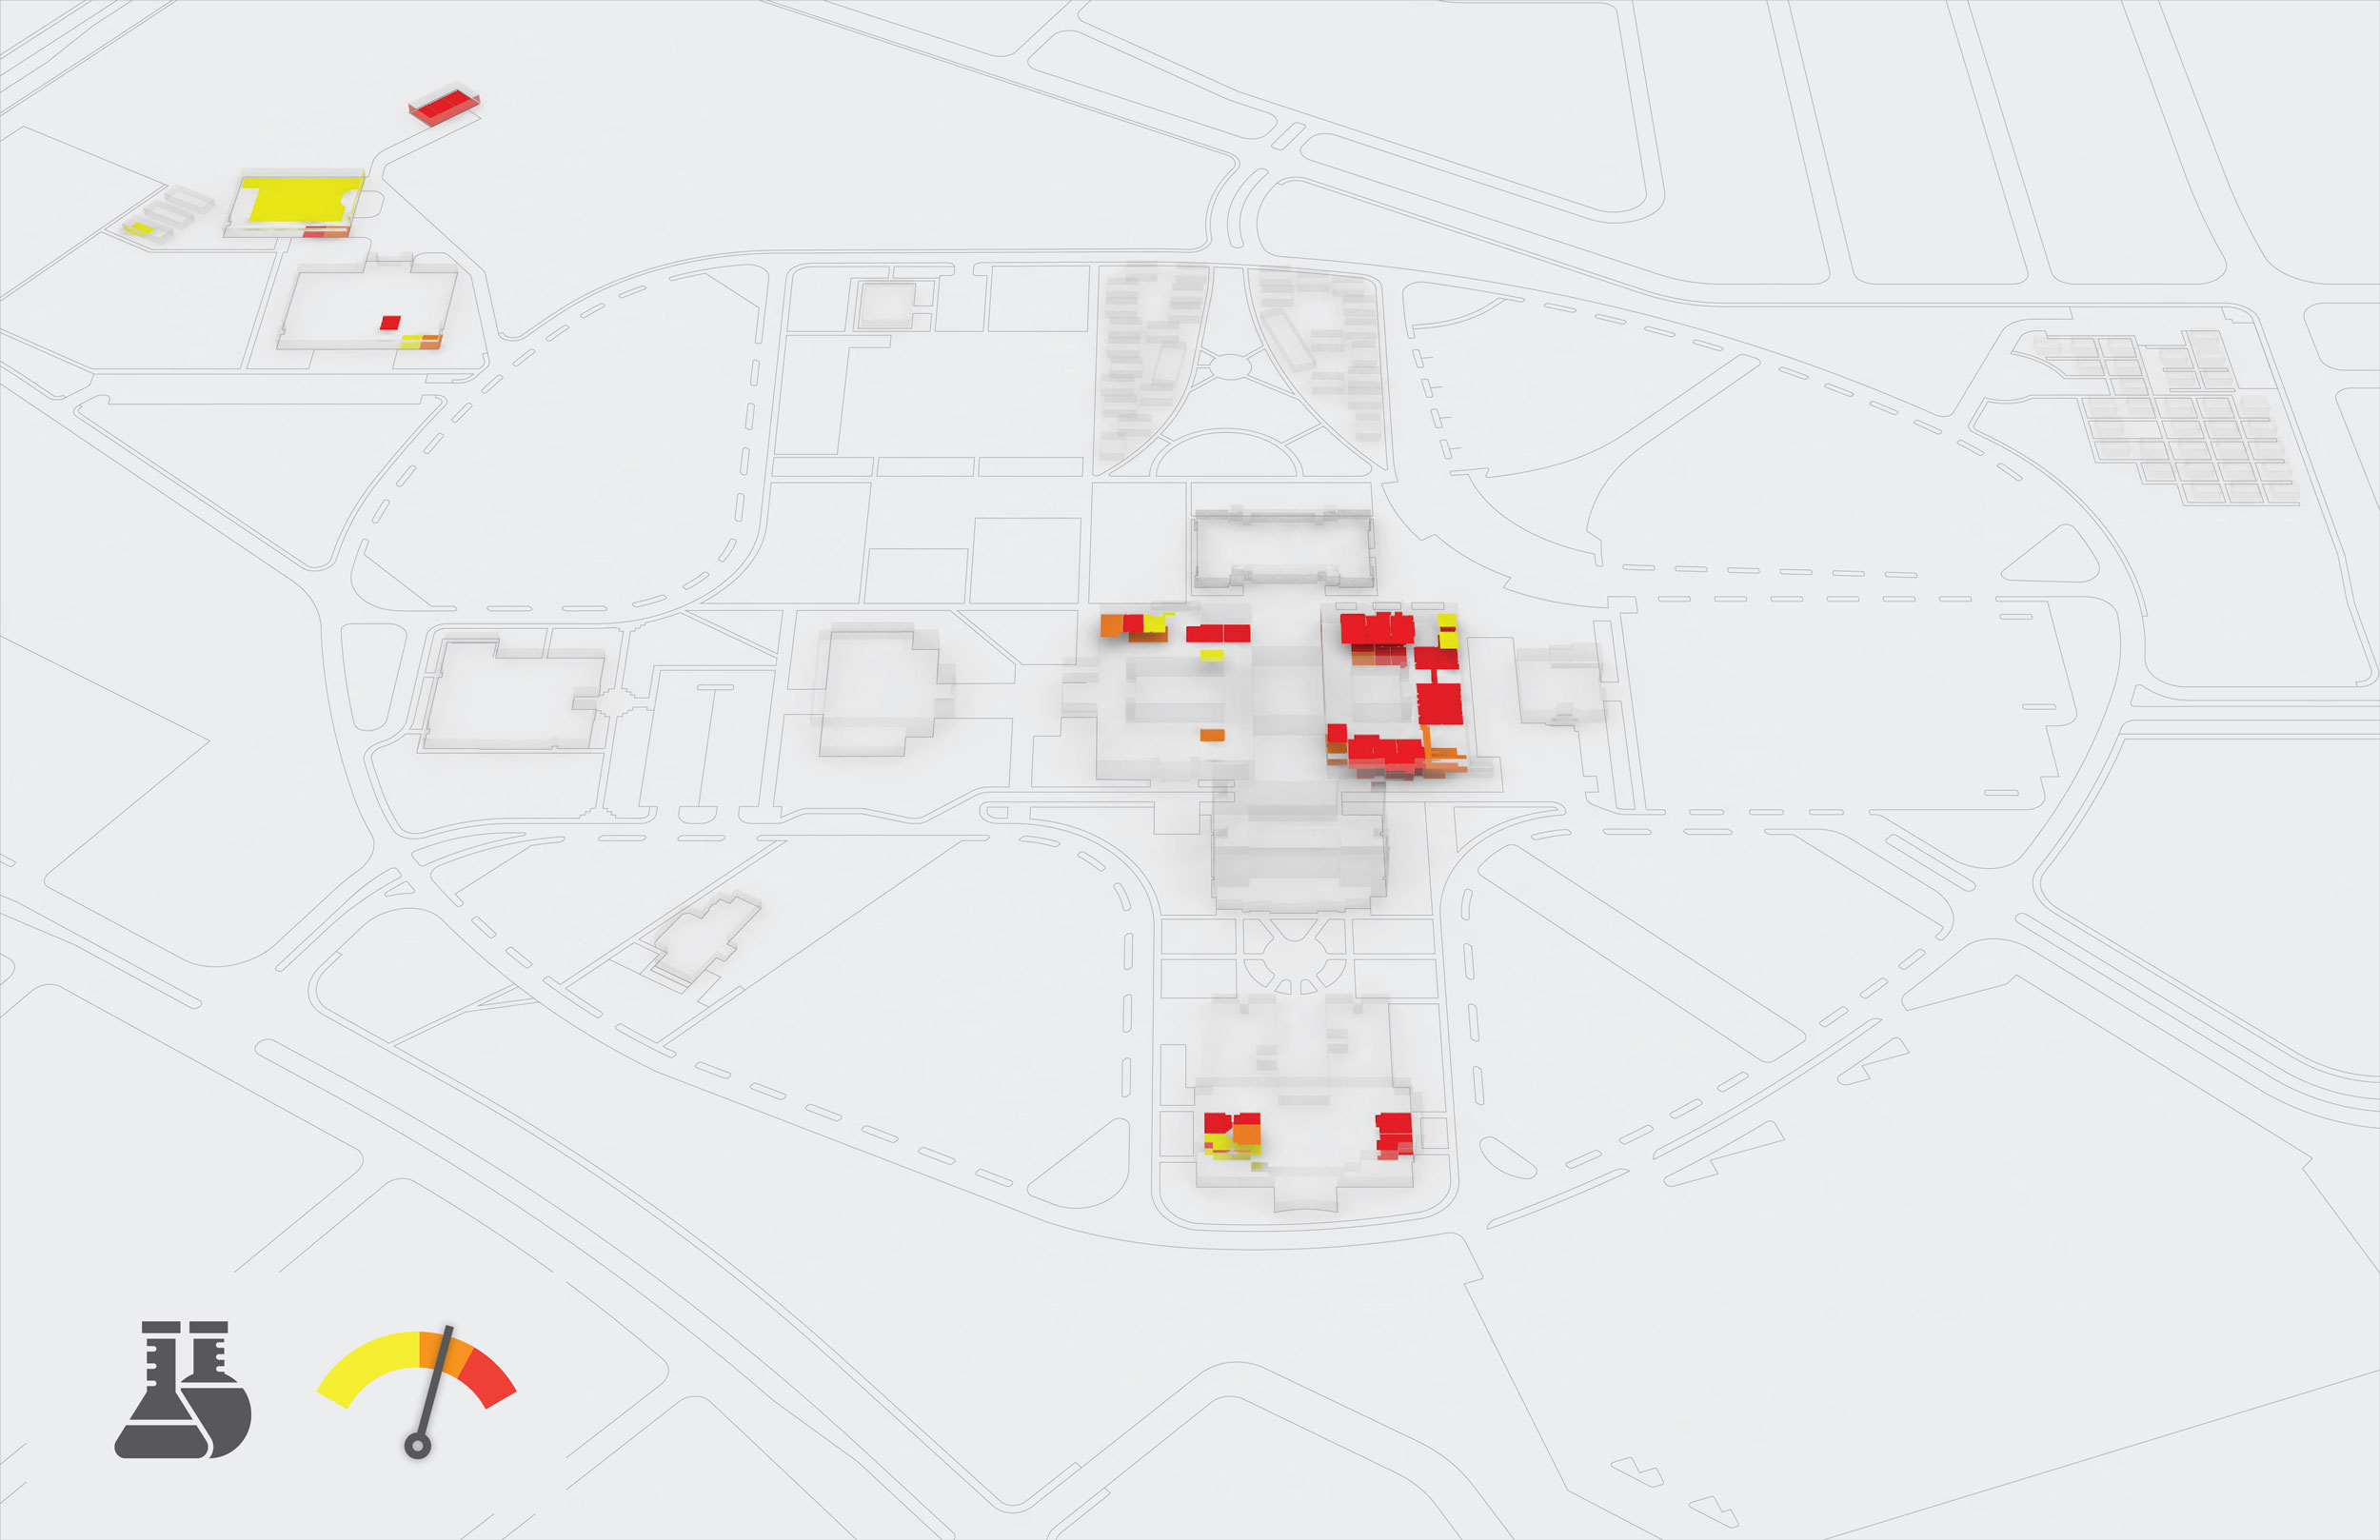
I created several analysis graphics for the El Paso Community College Master Plan. Regional demographic analysis maps were made by pairing census and student data in ArcGIS. Shown above are maps indicating all of the college's students and which of the 5 campuses they attend, regional transit routes and projected areas of growth in the city of El Paso. Classroom and Classlab utilization diagrams for each campus were created by modeling buildings and rooms in Rhino and then by selecting qualifying rooms with pivot tables in Microsoft Excel, which was then linked into the model via Grasshopper. Red rooms are those which are used intensely, while yellow rooms are used less so. Utilization findings helped determine the spaces and areas most appropriate for renovation.
CLIENT: El Paso Community College Master Plan (Texas)
ROLE: Modeler, Graphic Designer
SOFTWARE USED: ArcGIS, Illustrator, Photoshop, Rhino, Grasshopper